The Complete Guide to Thermal Mapping
Continuously Improving the Supply Chain Through Evidence-Based Insights
What is Thermal Mapping?
Thermal mapping, also known as temperature mapping, involves placing data loggers in predefined locations to measure temperature and humidity across a certain period of time. Thermal mapping is typically performed when storing or shipping temperature-sensitive products, such as vaccines, medications, and food. The goal of these studies is to ensure that the product temperatures remain in a specific range.
The following insights can be derived from these studies:
- The effect of open and closed doors on temperature
- Temperature changes across the seasons
- Hot and cold spots in a given location
- The effects of electronics on temperature
How is Temperature Mapping Done?
A mapping study involves putting data loggers in a given location to determine how temperature may fluctuate in a given space. This data can be used to mitigate inconsistencies in temperature readings, while flagging risk areas.
During this process, the following should be tested:
- Various temperatures across a space
- Temperature when doors are open
- Temperature when power is shut off
- Temperature of the room when empty and full
- Recovery after temperature has been destabilized
How many temperature monitors will be needed will depend on a variety of factors, including the size of a room or truck, air conditioning units, the location of the doors, and fan locations.
When Should Companies Conduct a Temperature Mapping Study?
Companies should conduct a temperature mapping study for the following reasons:
Inconsistency in Product Quality
If products are inconsistent in retaining their quality, QA teams should consider a thermal mapping study to determine how storage and shipping temperatures may be affecting the product.
Regulations
Regulatory bodies such as EU-GDP specify that thermal mapping be conducted.
New Products
If new products require new temperature perimeters, it’s important to ensure that warehouses and refrigerators can maintain these. For example: The COVID-19 vaccine needed to be stored at extremely cold temperatures.
New Equipment
When purchasing new equipment or a new warehouse, it’s important to identify risk areas, since temperature can fluctuate over a given space.
How Long does Thermal Mapping Take?
Thermal mapping results vary based on the locations being tested and observed.
Cold storage
These tests typically last between 24 hours to one week
Warehouse
These tests typically last a week
Shipping
The Importance of Thermal Mapping
Thermal mapping is considered a GMP (Good Manufacturing Best Practice) since it is one factor in maintaining product quality. At Sensitech®, many of our customers rely on our Professional Services team to gain evidence-based insights to continuously improve their supply chains. Below are some of the benefits of conducting a thermal mapping study.
Identify Risk Areas
The temperature in a warehouse or storage facility can vary. As a result, it’s important to conduct a thermal mapping study, to identify which areas are at risk of falling outside of the required perimeters.
Temperature monitors can later be placed in the hot and cold spots of a truck or warehouse to alert team members to potential product damage.
Preserve the Quality of the Product
For instance, our food customers are concerned about preserving the quality of temperature-sensitive products while they are in transit from source to consumer. Many of them have asked us to uncover root causes of temperature excursions that have caused damage to products during the shipping process.
For pharmaceutical and life science companies, medication may no longer be viable if not stored at the correct temperature.
Make Better Decisions with Analytics
Others want to explore new approaches for improving product quality through data analytics. With Sensitech’s team, customers can determine ways to improve the shelf life of their products through investments in technology, such as meat blankets for food, or ways to ensure that medication continues to remain viable. For example: Teams can determine in the case of severe weather how long products remain viable in a warehouse, should power be lost.
Case Study: How Thermal Mapping Improved the Transit Process
A major quick-serve restaurant chain asked us to research the impact of a process variation for how some of its bakery products, specifically two types of sandwich buns, were frozen and shipped.
The customer had been freezing the buns at the bakery prior to shipping. They wanted to explore what would happen if they shipped the products fresh and froze them while in transit.
The decision to freeze product during transport needs careful consideration as transport refrigeration equipment is typically optimized to hold product temperatures consistent during the journey, to save weight and fuel.
Previous Sensitech fieldwork has shown that it is important to minimize the amount of time starch-containing products stay in a refrigerated environment, as refrigeration can accelerate staleness. Therefore, we typically recommend that bread should either be:
- stored fresh at room temperature where possible to maximize shelf life or,
- if product is frozen, it should be frozen and thawed quickly to minimize the time spent in refrigerated conditions.
This particular customer wanted to test the quality impact of freezing its bread products during in-transit ocean shipments and understand if time-to-delivery improvements might be gained.
Using Thermal Mapping for Fact-Based Evidence
The thermal-mapping process for this specific scenario provided real-time data on:
- How long it took the product to freeze.
- If temperature uniformity was achieved inside the cases over the course of the shipping route.
- The overall impact of the process on quality.
The process began on site at the supplier, a bakery in California, where the bread products were made, put into plastic bags, and then into cardboard cases. The cases were stored in ambient conditions at the bakery for 24 hours, before being shipped by ocean liner to the chain’s distributor in the Hawaiian Islands, and then onto its restaurants.
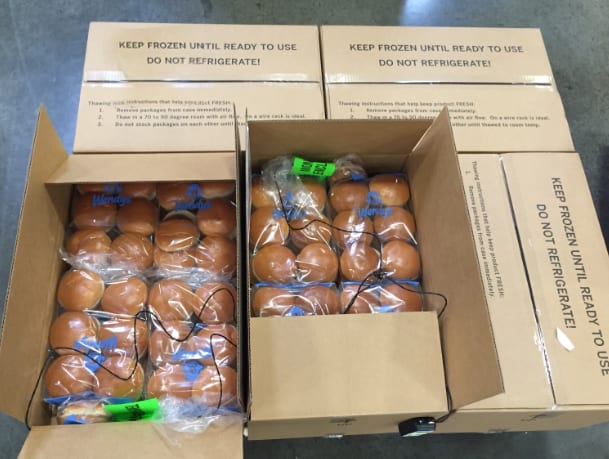
Image 1: Packaged buns with TempTale® monitors
Prior to the products leaving the bakery, Sensitech was on site to strategically place 36 temperature dataloggers inside the product cases. The cases were then organized onto six pallets. The team used single-sensor probes in the middle cases on the pallets and dual-sensor stainless steel monitors in the ones nearer the outer edges. The dual-sensor monitors measured both product temperature inside the cases during shipping, as well as ambient temperature outside of them in the shipping container.
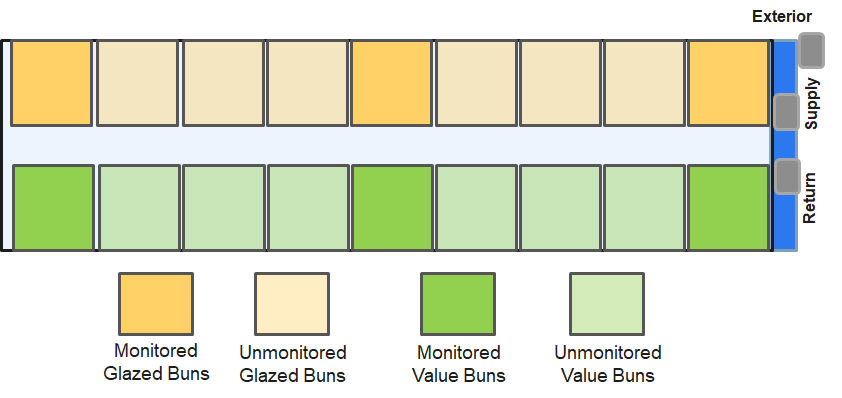
Image 2: Location of monitored and unmonitored buns in container by type of bun
The monitors collected temperature data from the time the goods left the bakery in California until they arrived at the distribution center in Hawaii. From the data collected during the shipping process, Sensitech determined:
- What temperatures the products were exposed to during the entire time in transit.
- How quickly the products froze and if they remained frozen during the entire shipment.
- How freezing variations occurred a) within each individual pallet and b) based on pallet location within the container.
- How the process affected the product upon arrival as its final destination.
Driving Better Results with Real-Time Data
The thermal mapping study collected real-time data throughout the entire shipping journey; the data was correlated with our customer’s objectives. For instance, the standard temperature this customer used for freezing its product was 20°F. We correlated that with the shipping container’s set point of -10°F, which was reached the second day of transit.
Here is an overview of what we discovered in relationship to those set points:
- Over the course of the seven-day shipment, there were ambient temperature variations throughout the cases, from floor to ceiling, with the cases in the middle of the pallets remaining the coldest.
- There were daily variations in product temperature over time, from 75°F initially at the bakery to, in some instances, below -5°F, which occurred on day seven of the shipment.
- Product near the core of the pallets reached the ideal 20°F in an average of 1.9 days, with the longest layer achieving that temperature in 3.8 days for one product and 2.6 days for another. Product at the corners reached that temperature in 0.7 days.
- By applying a weighted average, the data indicated that the time required for the average bun inside the case to reach 20°F took about two days.
- Regardless of bread type, time to 20°F varied widely throughout the cases and depended more on product location within the pallet rather than location inside the cases.
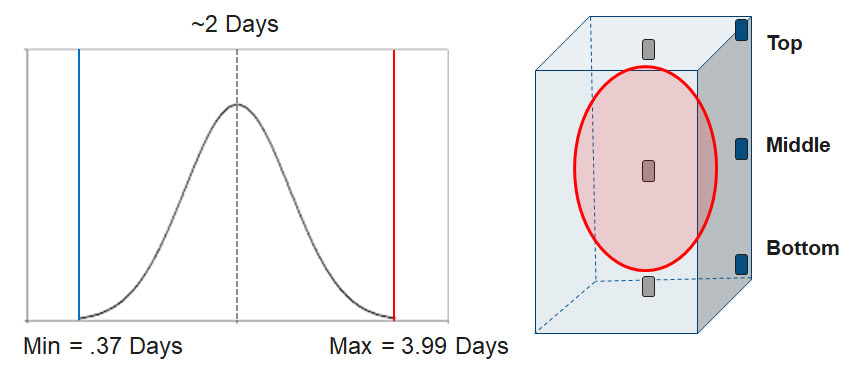
Image 3: Graph showing length of time needed for buns to reach 20°F
Enabling better decision making and improved product quality
Based on the data collected and on-site observations, Sensitech provided the quick-serve restaurant chain with insights that would help them decide whether to further explore this option. Sensitech offered several suggestions on how, if the customer pursued this approach, the overall results and product quality could be improved.
Loading Configurations
- There could be more uniform temperatures throughout the cases if airflow increased between the pallets by adjusting the loading configuration to reduce open floor space in the container. Typically, cold air flows from the floor of a container to the ceiling, following the path of least resistance. Therefore, if the amount of empty space in the trailer were reduced, the air would be forced through pallets rather than open spaces.
Packaging
- These particular products were shrink-wrapped on the pallets. By utilizing pallet corner boards and straps instead of shrink-wrap, the pallets would be kept in place during transport and allow for increased air flow through cases and faster freezing of the products.
- Because products were in cardboard cases with minimal openings, there was limited air flow. A more optimal option would be cardboard boxes with air holes, or reusable plastic containers (RPCs), both of which would increase air circulation and product temperature uniformity throughout the pallet.
Product Location
- Products located in the middle layer of cases in the core of the pallets took up to two days longer to freeze compared to the pallet exteriors. Using a chimney in the center of the pallet would increase air flow through the core cases and reduce freezing times.
With this information, the customer can now make a better-informed decision on whether or not the tested process, with these additional recommendations, would be a viable process moving forward. The chain can weigh whether freezing the products in transit rather than prior to shipping significantly improved the overall process without compromising product quality upon arrival at its restaurants.
Pharma Company Determines Product Placement Using Data
A large pharmaceutical customer required storage monitoring data that would allow them to bring their warehouse environment into specification without frequent temperature excursions. Additionally, the customer required a documented process to demonstrate their control of the temperature in their facility. They used Sensitech Professional Services to conduct a thermal mapping study, with the goals to provide:
- Permanent ColdStream® Site sensor placement recommendations to allow accurate temperature monitoring and enable confidence in the environment’s set point temperature
- Audit-ready documentation that the warehouse environment was in specification
Thermal mapping demonstrates control of a storage environment by placing temporary sensors throughout a facility, trailer or storage equipment to identify its worst-case positions—those that are subject to temperature fluctuations or prone to excursions. The resulting data allows a facility to install monitoring sensors in positions that ensure accurate temperature monitoring, with testing and processes documented to ensure quality compliance.
Sensitech Professional Services ranks all positions monitored using TempTale devices during the thermal mapping based on severity of temperature control and uses this ranking to define the best locations for permanent monitoring with the ColdStream Site system. At the end of a mapping, customers are provided with a detailed report that turns raw data into actionable information for ongoing temperature management.
Patterns Uncovering Unknown Problems
The thermal mapping process took place over a two-week period during the summer. Regulators require studies in summer and winter, and evidence supports that a two-week period is the ideal timeframe to account for both procedural operations that can affect temperatures within an active storage facility and external weather variations that may influence internal temperatures.
This scenario provided detailed data including:
- Three-dimensional temperature mapping of the warehouse and its cold room
- Analysis of frequent low temperature excursions
- Impact of regular high temperature excursions
Sensitech’s continuous two-week study provided full line-of-sight into the ways active workers affected the internal temperature of the customer’s cold room, as well as a more complete understanding of the external weather variables’ impact on the warehouse interior temperature. In this unusual case, this storage environment had both hot and cold excursions occurring concurrently in close proximity. Both issues had been observed by the customer, but the root causes had not been identified.
Extensive cold chain expertise enabled the build out of a reliable protocol for this environment. The team determined the quantity of sensors necessary for its size and layout, and divided the sensors and areas into low, medium and high placements depending on height to account for the three-dimensional space.
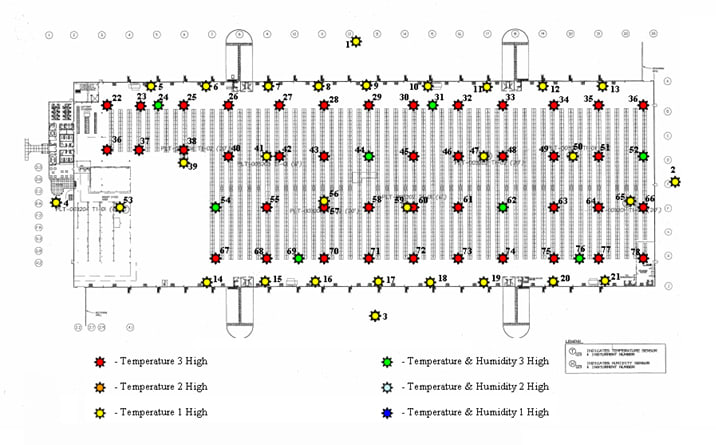
TempTale sensor placement plan to thermal map the customer’s warehouse
Sensitech positioned sensors in a grid pattern throughout the warehouse and cold room storage spaces, with a focus on geometric extremes and locations most prone to temperature deviations. Because Sensitech manufactures its own sensors, the placement was granular and specific to allow deeper analysis into factors such as how stored products’ positioning might impede airflow.
Regulations require that environments with adjoining external walls also account for external temperature influence. In order to get a full picture of this outside weather influence, Sensitech placed sensors on the exterior of the building to monitor daily external temperature changes.
Unlocking Good Temperature Management
A procedural issue was the first major contributor to fluctuations across the facility. Sensor data identified a recurring temperature incursion when the cold room’s door was opened, allowing hot air into the cold room and causing cold air to circulate into the warehouse storage environment. Patterns suggested the cold room door was not being opened and closed normally, but left ajar as people worked, unaware that they were bringing the two storage environments out of their temperature specifications.
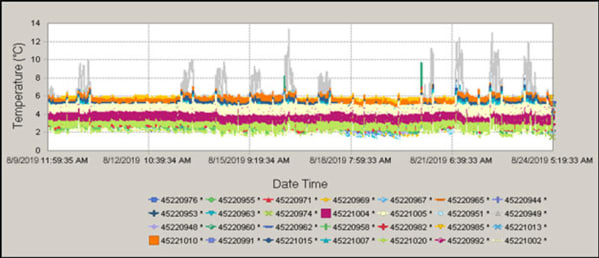
Cumulative cold room temperature data demonstrated high peaks during the work week, and temperatures that ran too cold on weekends, indicating poor open door management and an incorrect set point.
The cumulative sensor graph shows the cold room temperatures over time. The sensors closest to the doors show a “work schedule” result, in which the temperature peaks correlate with eight-hour work days and five-day work weeks. The lower end of the graph illustrates that the environment’s set point was too low. This resulted in a combination of too-cold temperatures in the cold room broken up by heat incursions from poor open door management.
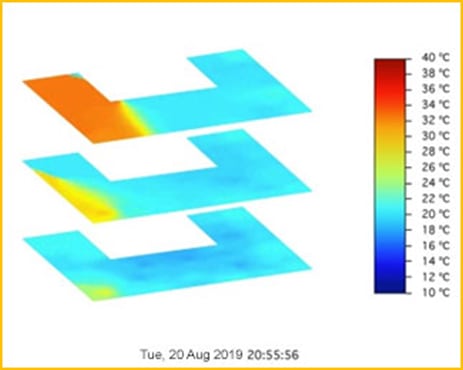
Hot airflow (top left) circulating in close proximity to a cold excursion (bottom middle) outside the storage environment’s cold room.
The data also discovered that this customer’s warehouse storage environment had a recurring problem with high temperature air circulation just a few meters away from the cold room.
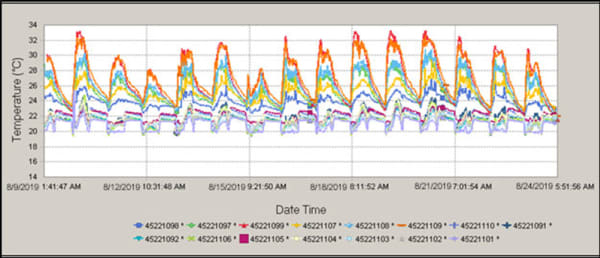
In the graph above, temperature variations correlate with the daily weather cycle. Investigating the location of the heat incursion from our three-dimensional analysis, the customer discovered that the insulation within the western wall had suffered damage the previous year. External temperature conditions were affecting the warehouse, with temperatures rising at the hottest parts of the day and falling during the coldest parts of the night.
Turning Data into Information, into Action
Sensitech’s thermal mapping service recommended ideal permanent sensor placement positions with supporting regulatory documentation and provided the information needed to improve the facility’s overall temperature management. These improvements were made both at the procedural and facility level.
Reducing Cold Temperature Excursions
- Understanding that the hot excursions inside the cold room and cold excursions in the warehouse were caused by the cold room doors being held open highlighted necessary changes in procedures and training.
- Sensitech provided assistance to devise new standard operating procedures for the facility to ensure that the cold room was operable without causing excursions for nearby products.
- This customer had intended to increase facility insulation in specific areas to mitigate their cold excursions, but our analysis identified a faster and more cost-effective training solution that brought their overall processes back into compliance.
Mitigating High Temperature Excursions
- Fourteen-day analysis using granular sensor placement and external temperature monitoring allowed Sensitech to observe that frequent high temperature excursions correlated with daily external temperature fluctuations.
- Three-dimensional thermal mapping processes identified the area in which these temperature fluctuations were occurring. Investigating that area uncovered a section of insulation that had been damaged, unknown to the customer.
- Customer replaced the damaged insulation, saving thousands of dollars in unnecessary additional air conditioning capacity.
Sensor Placement
- The original purpose of the study was to recommend proper permanent sensor placement and install ColdStream Site sensors in those locations, allowing renewed temperature accuracy.
- Audit-ready documentation demonstrated the new capacity of the two storage environments to remain within specification, as well as the procedural changes taken to manage this temperature control.
Sensitech met the customer’s original requirements by recommending sensor positions, and installed ColdStream Site sensors in those locations. By turning the customer’s raw data into information that enabled temperature management improvements across the entire storage environment, they had attained an additional layer of regulatory compliance. The customer was able to confidently demonstrate full control over their facility, with audit-ready testing, processes, and documentation in place.
For more information on Sensitech’s thermal mapping studies, visit our Professional Services site. To learn more about how our cold chain monitoring solutions and expertise can support your operations, Contact Us today.

